Ray-traced propagation
Follows signals from each cell through a 3D scene, including reflections off walls and buildings, and turns them into coverage maps.

Radio planning · NVIDIA Sionna
We use NVIDIA Sionna, an open-source, GPU-accelerated wireless simulator, to ray-trace radio signals through a 3D model of your site. You get coverage maps, dead zones and expected data rates for labs and 4G/5G radio projects before you buy or mount any hardware.
2-minute explainer, no sound · tap the full-screen icon to watch large
Sionna is a library from NVIDIA for wireless research. It has three parts, and we use all of them.
Follows signals from each cell through a 3D scene, including reflections off walls and buildings, and turns them into coverage maps.
Simulates the 5G waveform bit by bit, so a coverage map can be turned into error rates and data rates.
Runs on NVIDIA RTX cards. Our lab runs it on a 12 GB RTX 3060.
Sionna was built for machine learning as well as for maps. That changes what we can do for you.
Every result has gradients, so an optimiser can move antennas and adjust tilt and power to improve coverage automatically.
Train and test AI channel estimators and detectors for 5G, for research labs that want to go further.
Generate realistic channel datasets for training AI models without weeks of field captures.
Learn wall and material properties from measurements, so predictions match what your radios see.
Everything below was produced with Sionna on the CelTech lab machine.
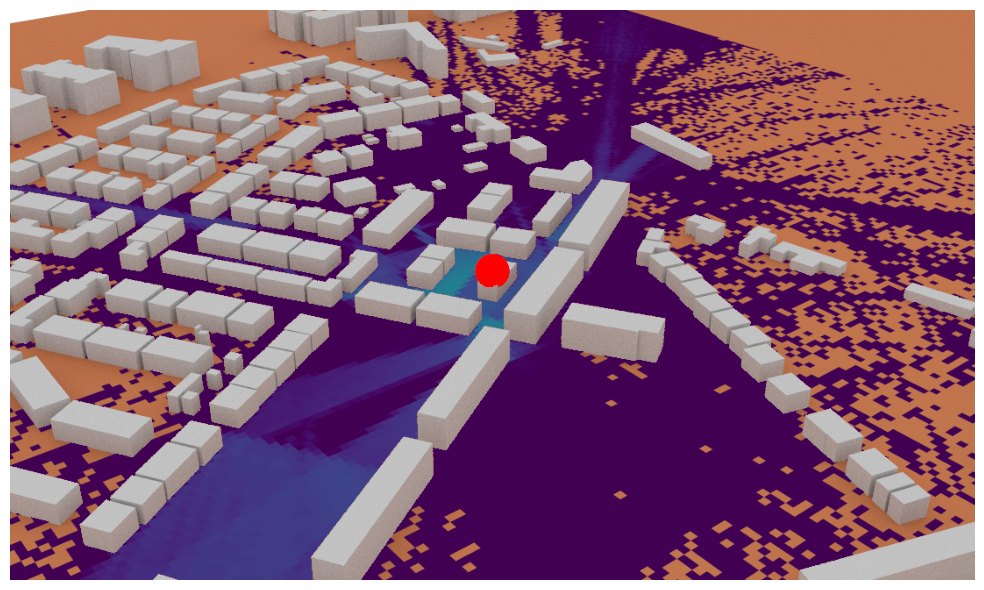
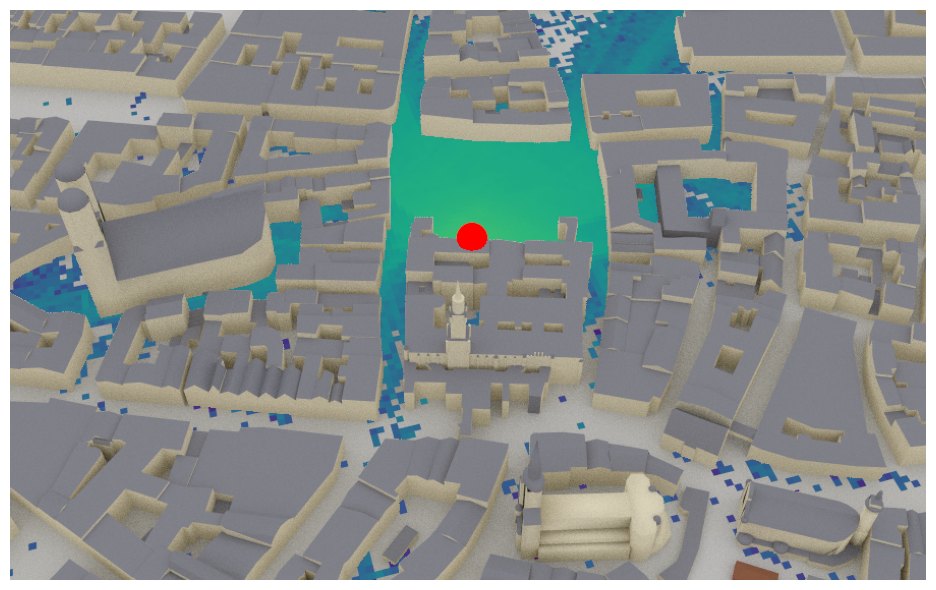
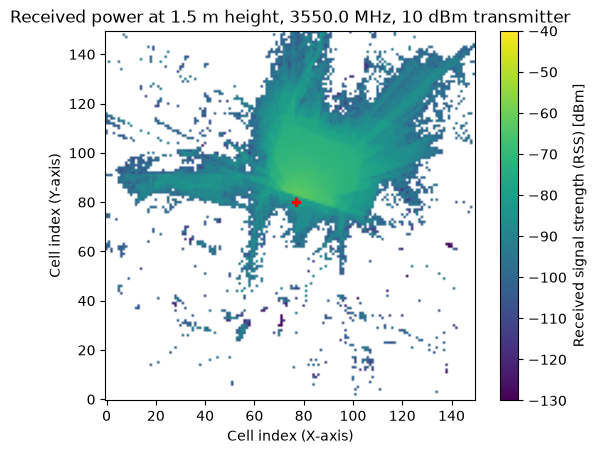
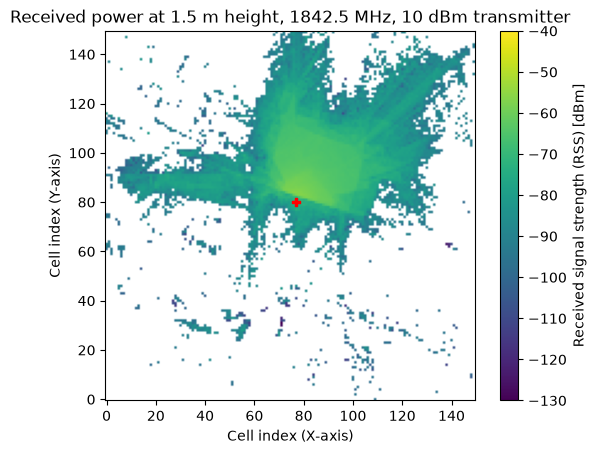
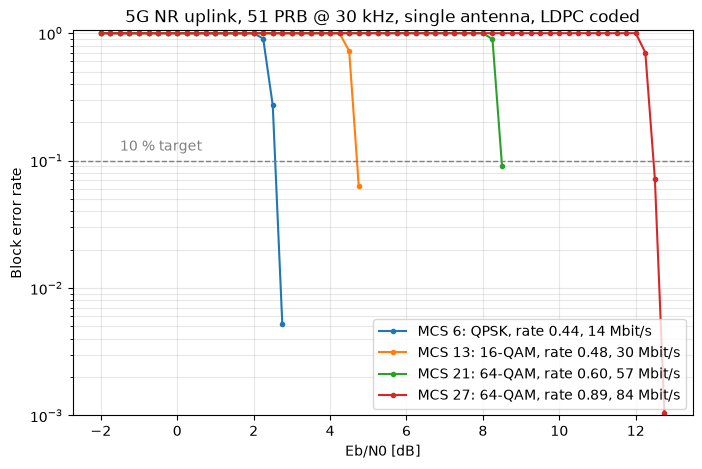
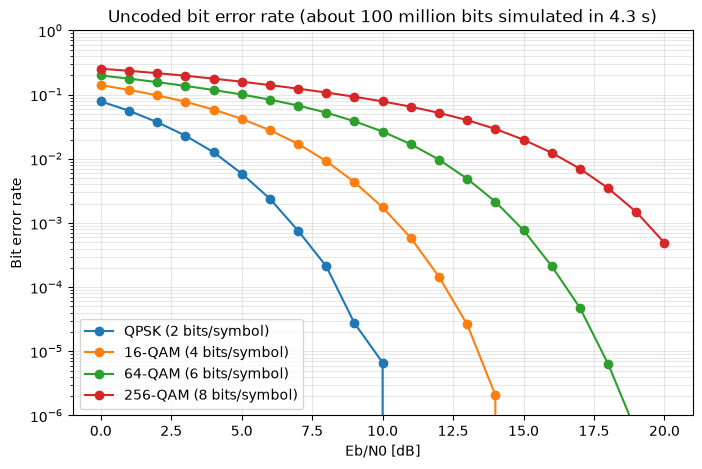
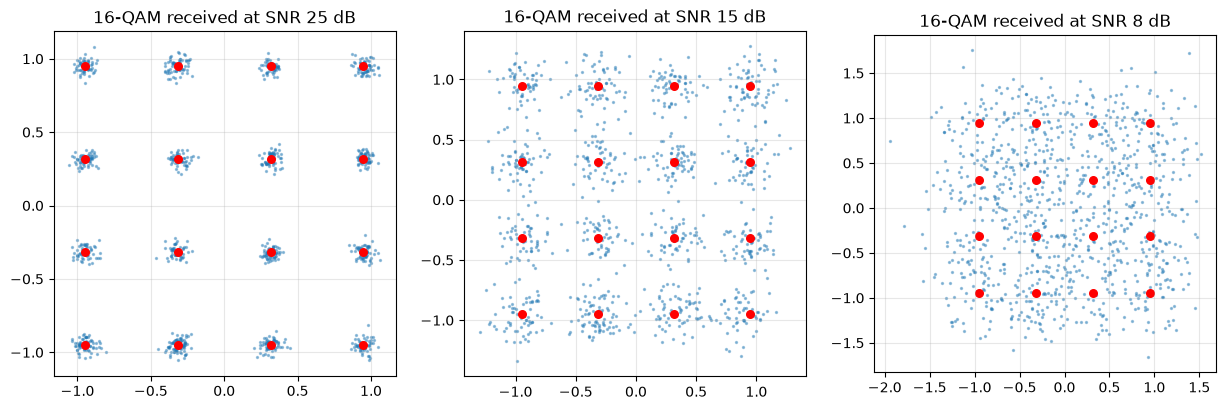
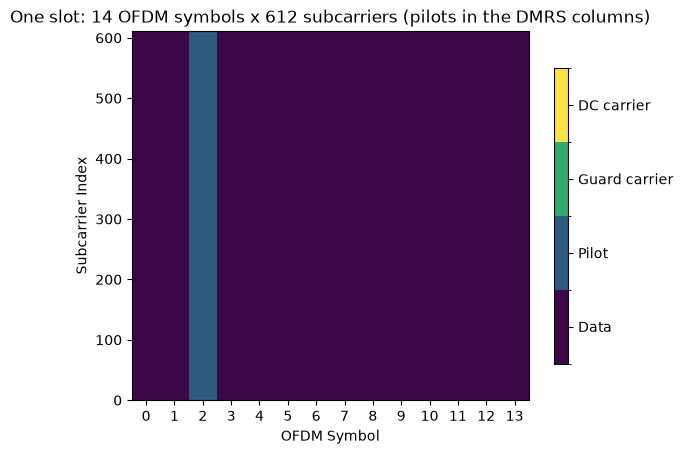
For labs and 4G/5G radio projects, each study answers practical questions about the site.
| Output | What it tells you |
|---|---|
| Coverage and signal strength map | Expected signal for every part of the site, at the height people and devices actually are. |
| Dead zones | Where coverage drops out, found before any hardware is installed. |
| Multipath detail | Path delays, delay spread and angles of arrival, which matter in factories and other metal-heavy spaces. |
| Interference and SINR | How several cells, or a neighbour’s network, affect each other. |
| Expected data rates | Which modulation and coding each area supports, from link-level 5G simulation. |
| Optimised antenna placement | Recommended positions, tilt, power and number of cells, found with AI optimisation. |
| Channel data for AI | Datasets to train and test machine-learning models in research labs. |
From a floor plan to cells on air.
Floor plans, CAD drawings or OpenStreetMap data become a 3D scene.
Coverage, multipath and interference for your band and power levels.
Antenna positions, tilt, power and number of cells.
SDR walk tests with a USRP B210 or LimeSDR, compared against the prediction.
Radios installed and tuned, handed over with a coverage report.
Tell us about the site and we’ll show you what a Sionna study would cover.
Animated panels in the explainer video are illustrative. 3D maps and charts are real Sionna output from the CelTech lab. NVIDIA and Sionna are trademarks of NVIDIA Corporation. CelTech is not affiliated with NVIDIA.